
Going The Extra (Ton) Mile?
February 5, 2021
Covid-19 caused dramatic changes in crude oil trade
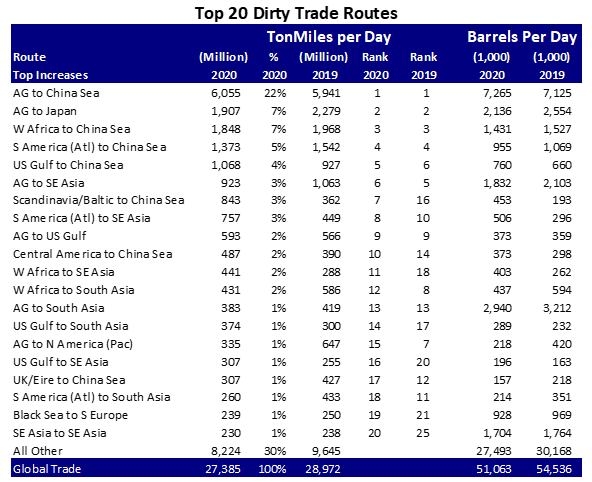
For many years, Poten compiled and published a ranking of the largest dirty spot charterers, based on reported spot fixtures. This annual ranking inspired us to list the largest crude and dirty oil trades in 2020 in a similar fashion. In the first table on the right, we show the 20 largest crude oil tanker routes for 2020 and compare them with 2019. We show the ranking in both million barrels per day (Mb/d) as well as million ton-miles per day (Mtm/d).
The first metric (Mb/d) allows the reader to put the crude oil trades in the context of global oil demand, while the second metric (Mtm/d) is the most relevant for the tanker markets, because it also considers the distance over which the oil is moved. In addition to the first table with the ranking of the largest trade routes, the second table highlights the biggest changes, both increases and decreases from one year to the next.
This analysis, which is derived from the APEX data of Lloyds List Intelligence, shows some interesting developments in 2020, many of which can be traced back to the Covid-19 pandemic.
To read the full article, please fill out the form.